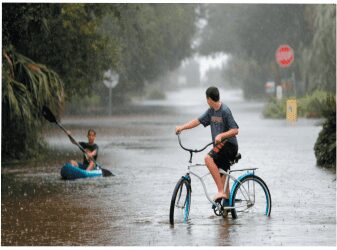
1. Floods may increase 300-fold on Atlantic, Gulf Coasts. Sea-level rise along the Atlantic and Gulf coasts combined with more frequent and violent storms could increase flooding from the Northeast to Texas by several-hundredfold, according to a new study out Monday
Over the past century, the East Coast has seen sea-level rise far above the 8-inch global average – up to a foot in much of the Mid-Atlantic and Northeast, including New York City. It is expected to increase as much as four feet by 2100, mostly due to the melting ice sheets as well as the expansion of the seawater as the oceans warm.
At the same time, several studies have suggest the North Atlantic could see more intense storms, since warmer waters contain more energy.
The authors analyzed 15 climate models at five locations: Atlantic City, N.J.; Charleston, S.C.; Key West, Fla.; Pensacola, Fla.; and Galveston, Tex. Among the things they looked at was the probability that the two factors could act together to lethal effect. Five models simulated both high local sea-level rises and increases in the strongest storms.
The authors also looked at the extent of the flooding if world leaders, meeting in Paris later this year, take action to cut emissions to stem global warming or if nothing is done. Frustratingly, the flooding is projected to increase even if the world works to cut emissions and keep temperatures from rising 2 degrees Celsius (3.6 degrees Fahrenheit) over what they were in preindustrial times.
The reduced-emissions calculations suggest a four- to 75-fold increase in the flood index – that is, the combined heights and durations of expected floods – across the five locations. If no action is taken, the flood index might go up 35 to 350 times.
“It’s an aggregate number over a big area – not a specific prediction for any one place,” said lead author Christopher Little of Atmospheric and Environmental Research, a company that performs weather and climate research, and related risk assessments. “But these projections help lay the groundwork for more specific research that will be valuable for adapting to climate change.” © 2015 CBS Interactive Inc.
2. Important Discussion About Water In Southern Arizona. The Central Arizona Project (CAP) and the WaterResources Research Center, University of Arizona, College of Agriculture and Life Sciences, will be hosting “Sustainable Water for Southern Arizona: Current Conditions and Future Prospects,” a free community water forum on Friday, Nov. 6, 7:30-11 a.m., at the Leo Rich Theater at the Tucson Convention Center, 260 South Church Ave. The forum is in partnership with the Southern Arizona Water Users Association, the Southern Arizona Leadership Council, plus a number of organizations that work to deliver, conserve, and educate about water in our region.
For more information and registration: http://bit.ly/1NRcNQy
3. City of Prescott Reaches Agreement Over Pollution in Watson Lake
By Melissa Sevigny • Oct 16, 2015
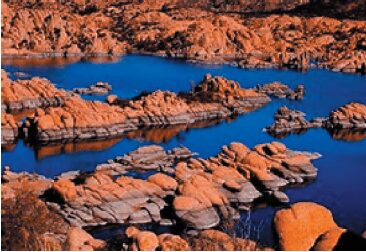
The City of Prescott has reached a settlement with environmental regulators over new pollution limits for Watson Lake. The agreement requires another look at the limits once more data is collected.
The City of Prescott and the Arizona Department of Environmental Quality have agreed to revisit the pollution limits set for Watson Lake three to five years from now. The settlement comes after complaints from the Prescott City Council that the limits were based on insufficient data.
Clyde Halstead, assistant city attorney for Prescott, says, “The settlement allows the city to develop a little bit of additional data, and for the lake model to be reworked, so we ensure it actually does was it was supposed to do.”
ADEQ issued a report on Watson Lake earlier this year. It determined that inputs of nitrogen and phosphorus have to be cut nearly in half to meet Clean Water Act requirements.
Krista Osterberg is the watershed protection unit manager for ADEQ. She says the settlement doesn’t change their plan for monitoring the water quality. “Both ADEQ and the city were already planning to collect this data,” Osterberg says. “The only thing that the settlement changes is it gives us a fi rm and short turn-around time for looking at this data again.”
Watson Lake has been listed as “impaired” since 2004. ADEQ will provide technical support and funding to projects in the watershed that help implement the cleanup

4. 51%. According to an article in the Wall Street Journal, 51% of all chefs and wait staff in restaurants are working when they are sick. Why do they show up for work? Several resaons: a) They don’t get sick leave so they come to work to make the low wages they have come to expect, b) Colleagues have come to expect they to come to work, even when they are sick. Bon Appitite!
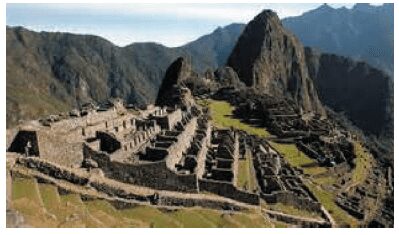
5. Historic: Climate Influenced Rise and Fall of Agrarian States . A pre-Incan civilization, the ancient city Tiwanaku, located in Bolivia, reached its apex between 500 and 1000 CE. Population estimates indicate at least 10,000 people lived in the city, which was constructed some 13,000 ft above sea level. Far-reaching, its cultural and political influence extended throughout the southern Andes, reaching into Peru, Chile and Argentina.
However, the city was eventually deserted around 1000 CE. Around the same time, the nearby Wari culture fell into decline. “There is a long tradition of archaeology in both central Mexico and the Peruvian highlands,” said Douglas Kennett. “There are also new high-resolution climate records available that have not yet been capitalized on by archaeologists.”
With assistance from climatologist and statistician Norbert Marwan, of the Potsdam Institute for Climate Impact Research, Kennett collected stalagmite from central Mexico’s Juxtlahuaca Cave and gleaned climate record data from the Quelccaya ice cap in the Peruvian Andes. From the ice and stalagmite, the researchers measured oxygen isotopes and were able to determine annual rainfall and temperature for 2,000 years in Mexico and 1,800 years in Peru.
States in Mexico. In Mexico, the researchers focused on three states: Teotihuacán (100 BC to 650 CE), Toltec (900 to 1150 CE) and the Aztec Empire (1400 to 1519 CE). “The fluorescence and expansion of Teotihuacán as a regional power between 100 and 500 CE occurred during an interval of persistent rainfall…but the population was in decline after 600 CE with existing political tensions amplified by some of the most volatile climate conditions evidence in the Juxtlahuaca Cave climate record between approximately 600 and 700 CE,” write the researchers. “This was followed by an extended drought after 700 CE.” The researchers hypothesize stable climate conditions led to political centralization, while unstable conditions led to sociopolitical instability and decentralization. Tula, of the Toltec Empire, was established during favorable and stable climate conditions. During its decline, smaller centers popped up in the region between 1150 and 1300. Wetter periods followed and, by the early 15th century, the Aztec city of Tenochtitlan was thriving. It grew to be a city of 200,000 people. Spanish conquistadors toppled the empire so their resilience against climate volatility is unknown.
Back in the Andes
Tiwanaku emerged alongside Wari, a polity that dominated the central Andes. “The agricultural systems sustaining Wari and Tiwanaku developed during warm and wet conditions in the highlands from 600 to 1000 CE,” the researchers write. “Under these conditions populations expanded. Climatic conditions were relatively stable through this interval and became volatile from 1000 to 1300 CE.” Smaller polities cropped up, and threat of war was persistent. Eventually, both the Wari and Tiwanaku polities disappeared, paving the way for the rise of the Inca Empire. The empire eventually developed irrigation technologies capable of providing a year-round water supply. However, the Incas faced the same fate as the Aztecs when the Spaniards arrived in the 16th century.
“The climate information in both areas is good enough to establish that climate is playing some role in the rise and fall of these city states,” said Kennett
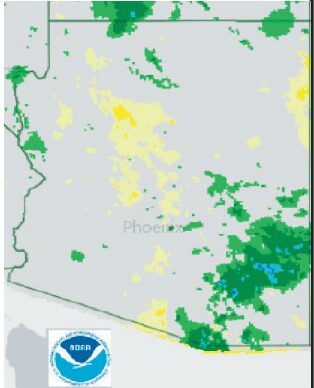
6. Climate. What’s Going On. Precipitation: Over the past 30 days, most of Arizona recorded average or near avrage precipitation, with notable exceptions in portions of southeast Arizona.
Even as the monsoon was wrapping up, the region had repeated incursions of tropical moisture, which brought occasional precipitation and helped keep dewpoints above expected values.
Temperature: Temperatures in the past 30 days were above average across most of the Southwest, with temperature anomalies between 0 and 6 degrees F across most of Arizona. Average temperatures in September were recorded among the top five warmest Septembers recorded in Arizona.
Monsoon: Variable spatial coverage and intensity, along with intermittent precipitation events, makes it difficult to characterize any monsoon as “normal.” That said, 2015 has been fairly typical for monsoon precipitation; and despite a persistent break in monsoon activity for much of August and early September, most locations saw regular precipitation events that brought their total precipitation close to longterm averages .
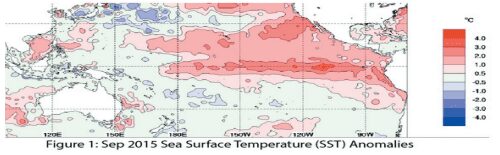
Tropical Storm Activity: El Niño events are associated with increased eastern Pacific tropical storm activity, and this year is no exception. At time of this writing, the eastern Pacific tropical storm season had recorded 10 hurricanes, seven of them major, four tropical storms, and three tropical depressions (Fig. 3). Accumulated cyclone energy (ACE) is a measure of tropical storm and hurricane strength and duration, and according to the National Hurricane Center, ACE was approximately 25 percent higher than the median value at the end of September. Activity has slowed somewhat in October, and the extent to which additional tropical systems will affect the Southwest in 2015 remains to be seen. While not directly related to monsoon circulation patterns, tropical storm activity is part of the seasonal cycle, helped buoy precipitation totals, and brought abundant moisture and persistently above-average dewpoint temperatures into the region.
Drought & Water Supply: The U.S. Drought Monitor identifies persistent multi-year drought across the West (Fig. 4). Arizona and New Mexico are still recovering from years of accumulated drought and water deficits, but average to above-average 2015 water year precipitation (October 1, 2014 to September 30, 2015) helped alleviate drought conditions, particularly in eastern New Mexico. Years of accumulated drought are not erased overnight, and while there is hope for above-average precipitation this winter (See El Niño Tracker), the possibility remains of a rapid transition into La Niña conditions, which tend to bring below-average precipitation to the Southwest.
See next page
Precipitation & Temperature Forecasts: The Oct. 15 NOAA-Climate Prediction Center seasonal outlook predicts above-average precipitation for most of the Southwest this fall into winter. Northern California and most of the Northwest are notable exceptions. Temperature forecasts are split, with elevated chances for above-average temperatures along the West Coast and extending to the western edge of Arizona, and increased chances for below-average temperatures centered over Texas and extending across most of New Mexico
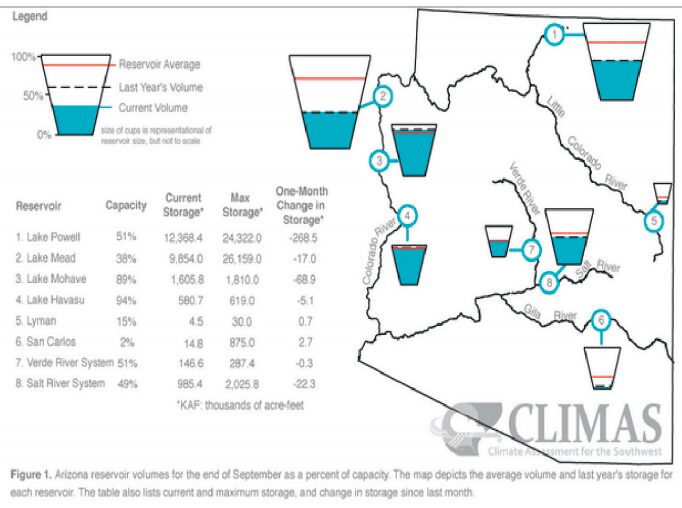
Reservoir Volumes
2015 Monsoon Recap. The monsoon started strong in late June and early July. This early start centered on Arizona, which recorded its second wettest June on record (Fig. 1a), with a return to relatively normal rainfall totals in July. New Mexico saw an increase in precipitation, recording its 10th wettest July on record (Fig. 1b). Following a break in the monsoon circulation, rainfall in August and September was average in Arizona and below average for New Mexico (Figs. 1c-1d). These statewide rankings do little to capture the spatial and temporal variability of the monsoon (see below), but they do give a sense as to the general character of the monsoon. As noted in the October SW Climate Podcast, the monsoon started strong, but tended to fizzle for most of August and September. However we did see a late season push from tropical storm activity, which helped push some of the monsoon seasonal precipitation totals just above average values.
x. 7. AZ State Fair Opens! AZ State Fair Opens!

Sheryl Crow
Thursday, October 22, 7:00 PM
Gary Allan
Friday, October 23, 7:00 PM
Austin Mahone
Saturday, October 24, 7:00 PM
Jack & Jack
Sunday, October 25, 5:00 PM
Jackson Browne
Wednesday, October 28, 7:00 PM
Jane’s Addiction
Otober 29, 7:00 PM
Flo Rida Friday,
October 30, 7:00 PM
Oct 16 to Nov 8
Open Wed – Sun
Saturday, October 31, 7:15 PM
Natalia Jimenez
Sunday, November 1, 5:00 PM
Aaron Lewis with William Elliott Whitmore
Wednesday, November 4, 7:00 PM
Jason Derulo
Thursday, November 5, 7:00 PM
Hanson with Nelson
Friday, November 6, 7:00 PM
Old School Jam
Saturday, November 7, 7:00 PM