Daniel Salzler No. 1283 EnviroInsight.org One Item December 6, 2024
—————Feel Free To Pass This Along To Others——————
If your watershed is doing something you would like others to know about, or you know
of something others can benefit from, let me know and I will place it in this Information .
If you want to be removed from the distribution list, please let me know.
Please note that all meetings listed are open.
Enhance your viewing by downloading the pdf file to view photos, etc.
The attached is all about improving life in the watershed through knowledge.
If you want to be removed from the distribution list,
please let me know. Please note that all meetings listed are open.
Check our website at EnviroInsight.org
- Climas: Climate Outlook For The Southwest. November
Precipitation and Temperature
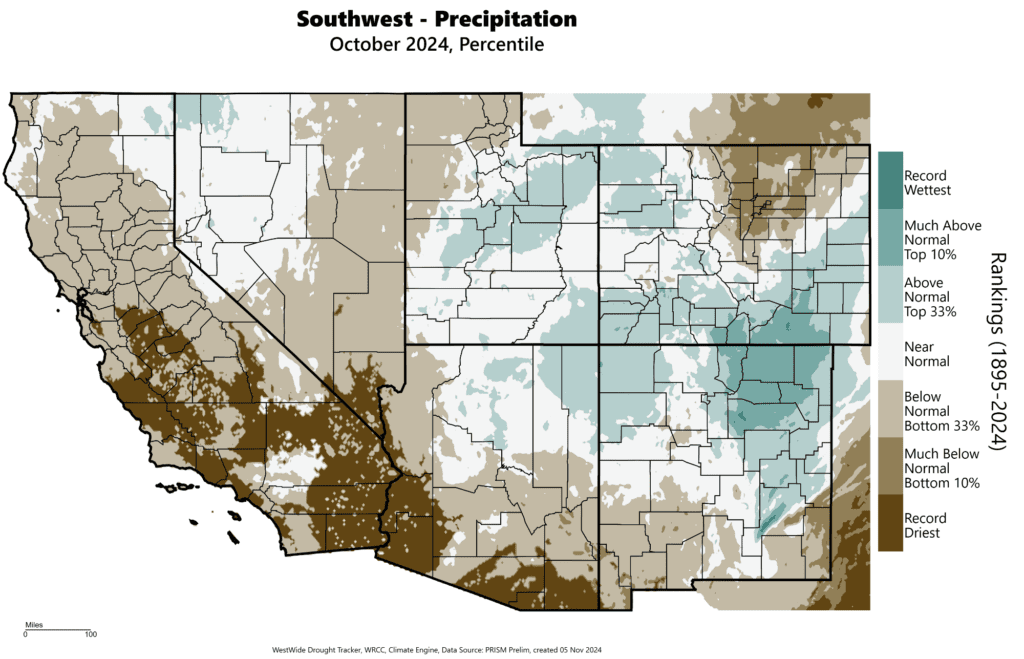
October precipitation was below normal across much of southern New Mexico, and across southern and western Arizona, where in places it was the driest October on record. Precipitation was near normal to above normal for northeastern Arizona and northern New Mexico, and much above normal in northeastern New Mexico. The rain event in Chaves County, NM that caused flooding in Roswell also broke October precipitation records.
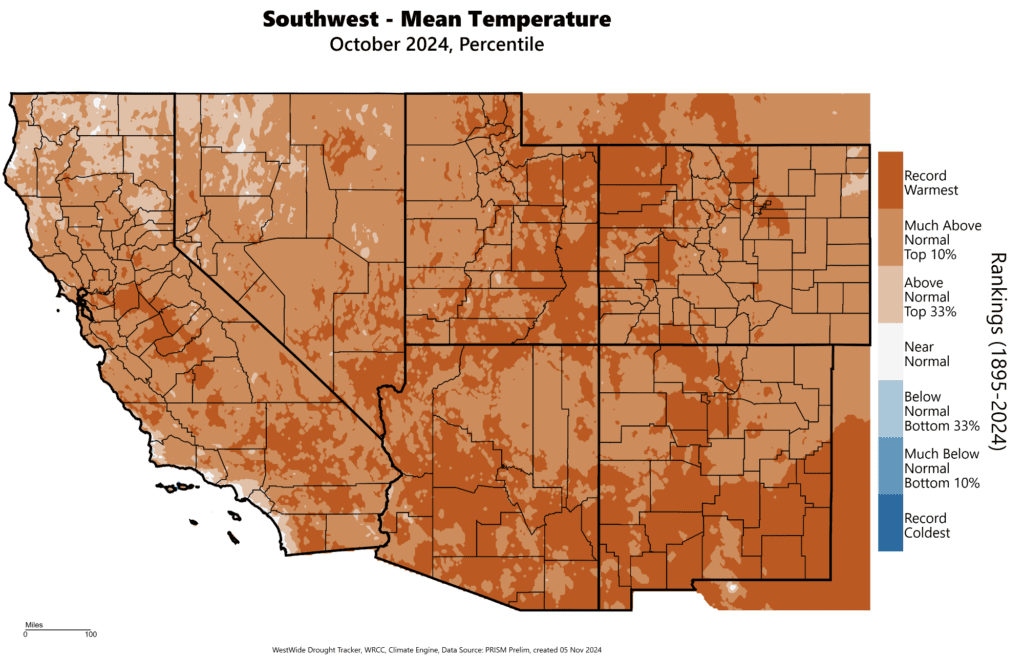
October temperatures were much above normal or warmest on record across Arizona and New Mexico, with the record warmest temperatures occurring more extensively across the southern parts of either state.
Source: WestWide Drought Tracker
October temperatures were much above normal or warmest on record across Arizona and New Mexico, with the record warmest temperatures occurring more extensively across the southern parts of either state.
Source: WestWide Drought Tracker
Drought
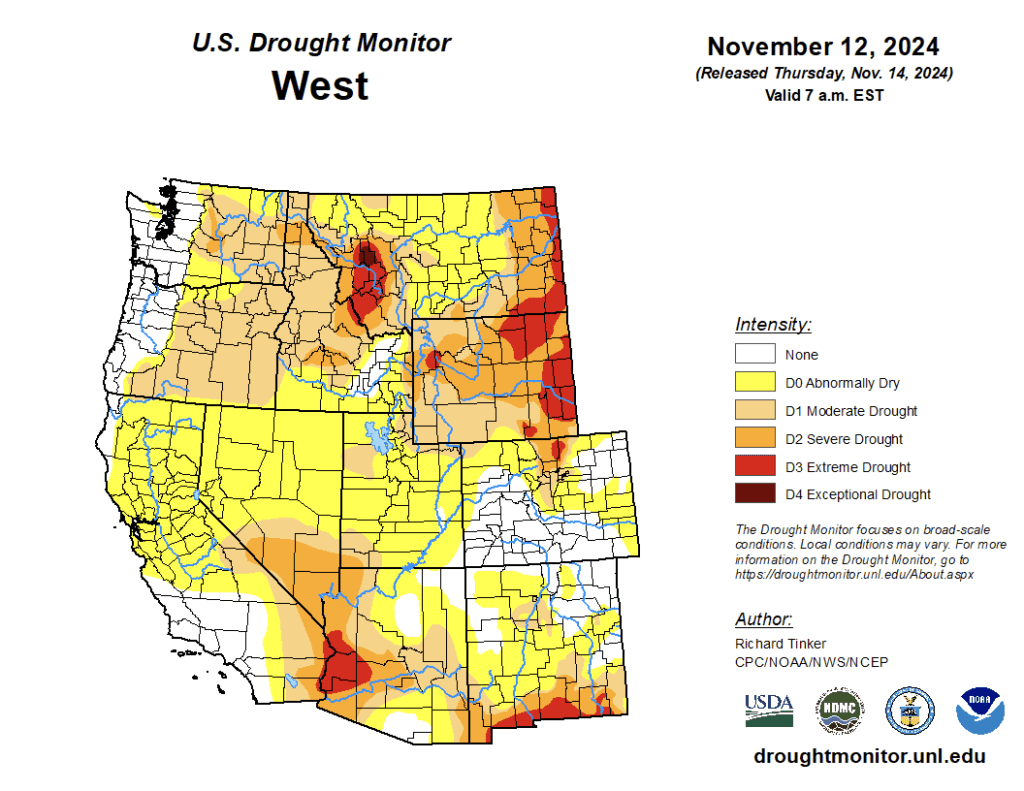
Generally, drought conditions have improved in New Mexico and worsened in Arizona. While extreme (D3) drought still affects over 5% of the state’s area in southern New Mexico, that figure is down slightly over last month, and the area of the state classified as abnormally dry (D0) or in moderate (D1) or severe (D2) drought has also been adjusted downward, however nearly two-thirds of the state remain abnormally dry or classified under a drought category. In Arizona, 85% of the state is abnormally dry or in drought, and an area of western Arizona has had its drought classification advanced to extreme drought.
Hurricanes & Tropical Storms
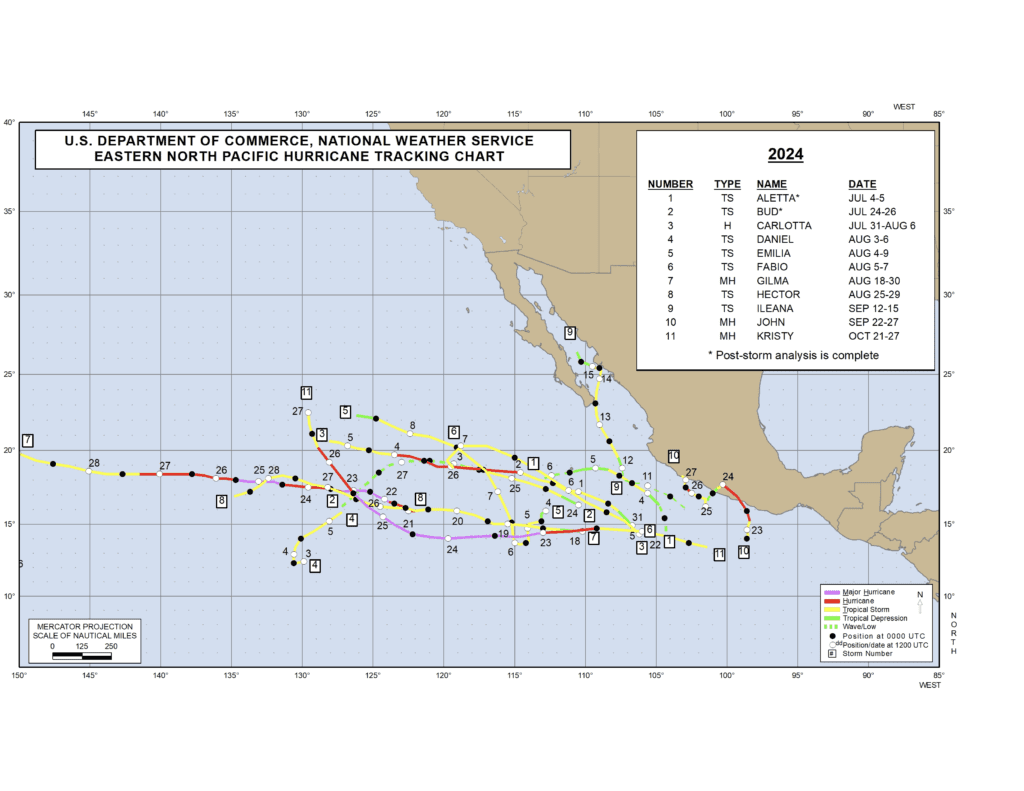
The end of November marks the end of hurricane season for the eastern North Pacific. This year the eastern Pacific was less active, with fewer named storms (11) versus the long-term average (14), and fewer storms that reached hurricane strength (4) than average (8).
NHC Tropical Cyclone Reports – 2024 Eastern Pacific Hurricane Season
Snowpack
The season of snow accumulation has begun and NRCS has resumed tracking of snow water equivalent (SWE) for snow-fed watersheds. Many basins are in good shape with SWE values above normal for this time of season. This early in the season, SWE estimates in Arizona and southern New Mexico are based on only a small number of stations, because for lower-elevation stations, the median value in the record is zero, and so no comparison with observations is made.
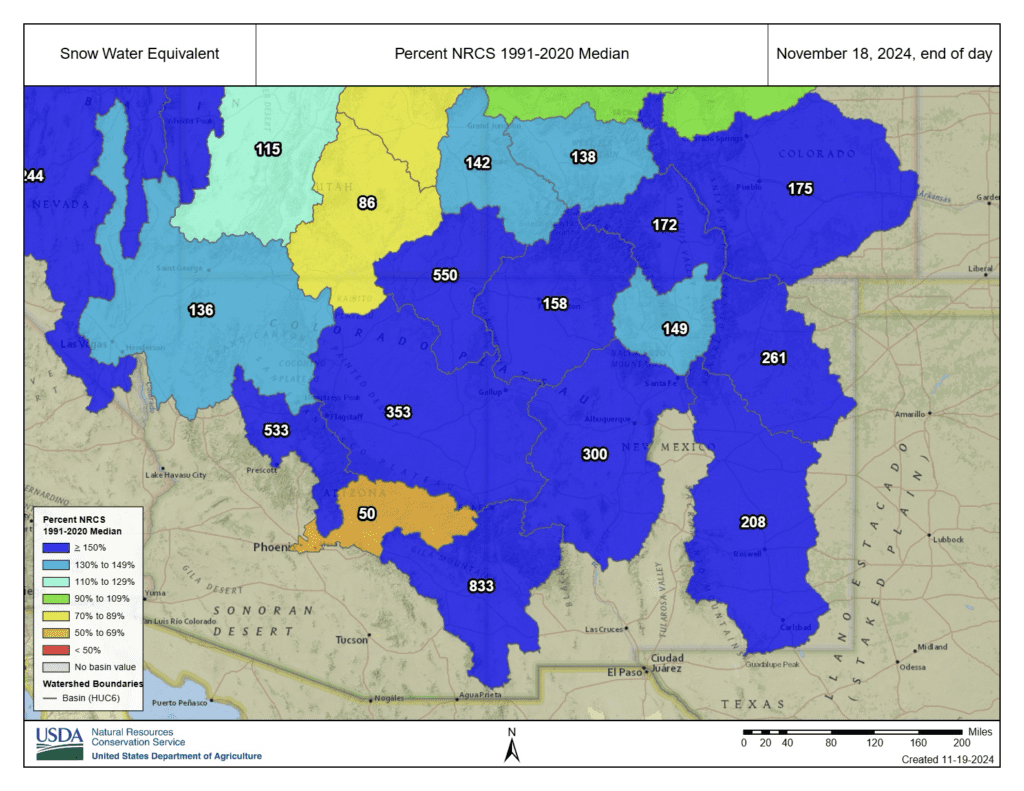
USDA-NRCS: National Water and Climate Center
Water Supply
Lake Powell and Lake Mead are holding about as much water as this time last year, which is still far below the long-term average. Other Arizona reservoirs are in good shape, generally holding near or above the long-term average amounts of storage.
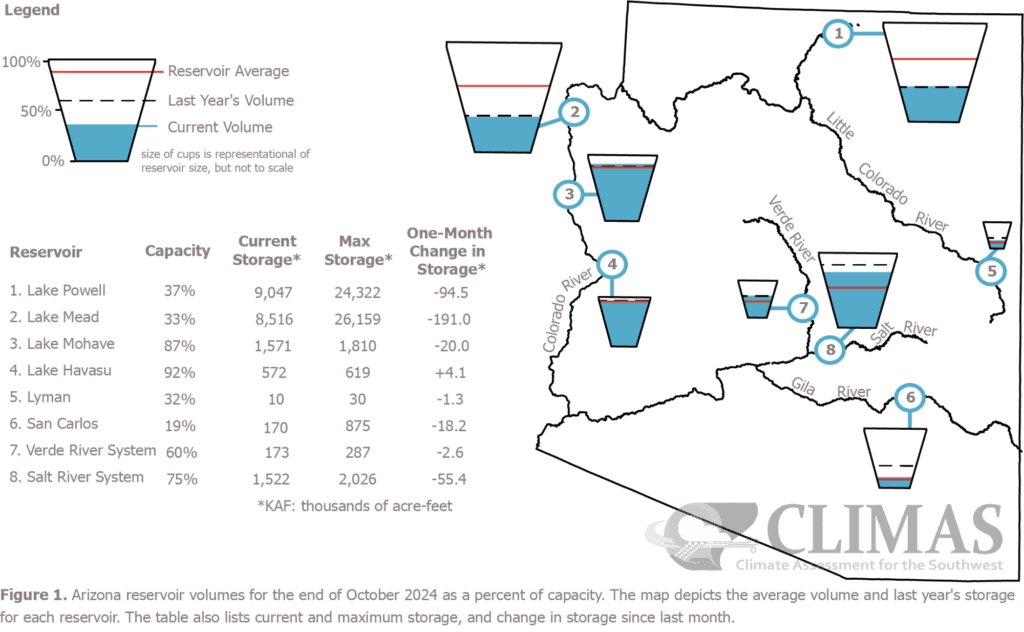
The map gives a representation of current storage for reservoirs in Arizona Reservoir locations are numbered within the blue circles on the map, corresponding to the reservoirs listed in the table. The cup next to each reservoir shows the current storage (blue fill) as a percent of total capacity. Note that while the size of each cup varies with the size of the reservoir, these are representational and not to scale. Each cup also represents last year’s storage (dotted line) and the 1991–2020 reservoir average (red line). The table details more exactly the current capacity (listed as a percent of maximum storage). Current and maximum storage are given in thousands of acre-feet for each reservoir. One acre-foot is the volume of water sufficient to cover an acre of land to a depth of 1 foot (approximately 325,851 gallons). On average, 1 acre-foot of water is enough to meet the demands of four people for a year. The last column of the table lists an increase or decrease in storage since last month. A line indicates no change. These data are based on reservoir reports updated monthly by the Natural Resources Conservation Service – National Water and Climate Center (USDA) .
ENSO Tracker
Sea surface temperatures (SSTs) in the equatorial Pacific have been for months exhibiting a La Niña-like pattern of cooler-than-average SSTs in the central-eastern Pacific and warmer-than-average SSTs in the western Pacific. That pattern continued through October, but the pattern has remained too weak—SSTs too close to average—to be considered the start of La Niña conditions.
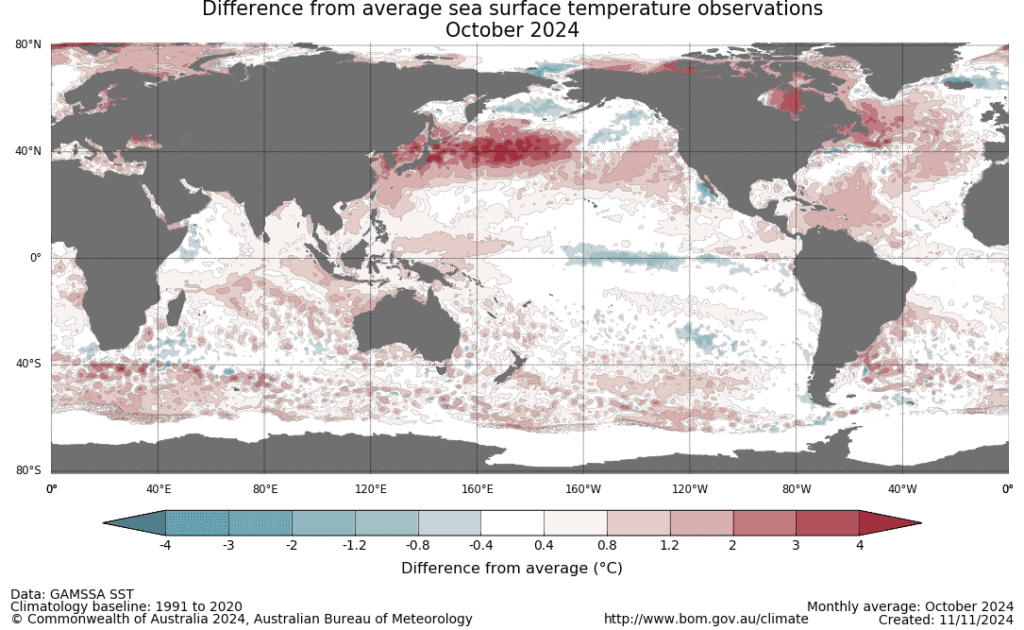
Source: Australian Bureau of Meteorology
SST forecasts differ between different models, with some models indicating a strengthening of cool SST anomalies into a La Niña event, but others, like the Australian ACCESS-S2 model forecast shown here, indicate a weakening of the cool anomalies and a movement of the system away from the La Niña threshold.
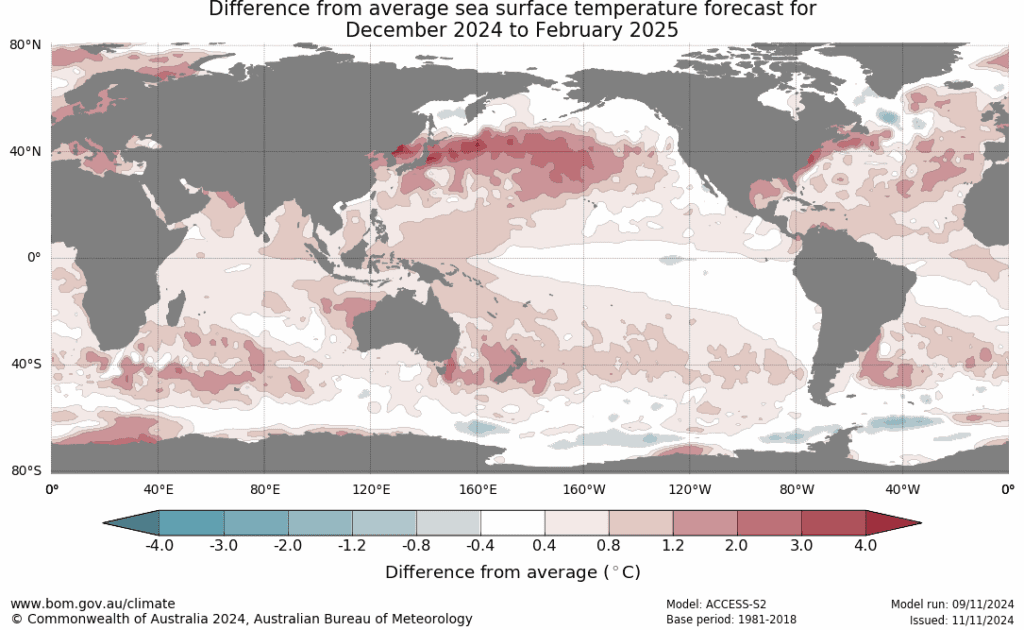
SST anomalies (SSTs) averaged over the four ENSO monitoring regions have showed no persistent cooling trend through October and November. The most recently measured SSTs in Nino 3.4 have been close to long-term average, a return to more ENSO-neutral temperatures after a few months near the La Niña threshold of -0.5°C.
Source: Australian Bureau of Meteorology

Source: Climate Prediction Center (NOAA)
The probabilistic ENSO forecast gives around equal chances of either ENSO-neutral or La Niña conditions for the November – January and December – February forecast windows. In subsequent forecast windows, ENSO-neutral is favored.
The probabilistic ENSO forecast gives around equal chances of either ENSO-neutral or La Niña conditions for the November – January and December – February forecast windows. In subsequent forecast windows, ENSO-neutral is favored.
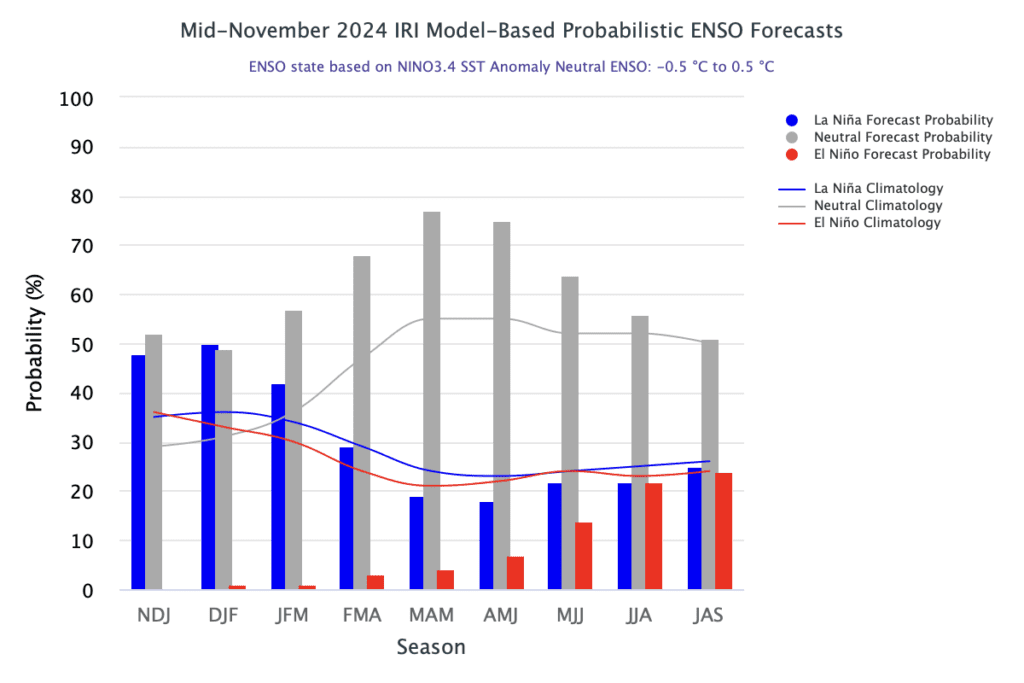
Source: The International Research Institute for Climate and Society, Columbia University Climate School
The plume of individual-model ENSO forecasts shows the relative (dis)agreement among models that informs the above near-50/50 chance of La Niña versus ENSO-neutral in the coming months—about half of the models predict Nino 3.4 SSTs cooler than the La Niña threshold of 0.5°C below average, the other half predict SSTs closer to normal.
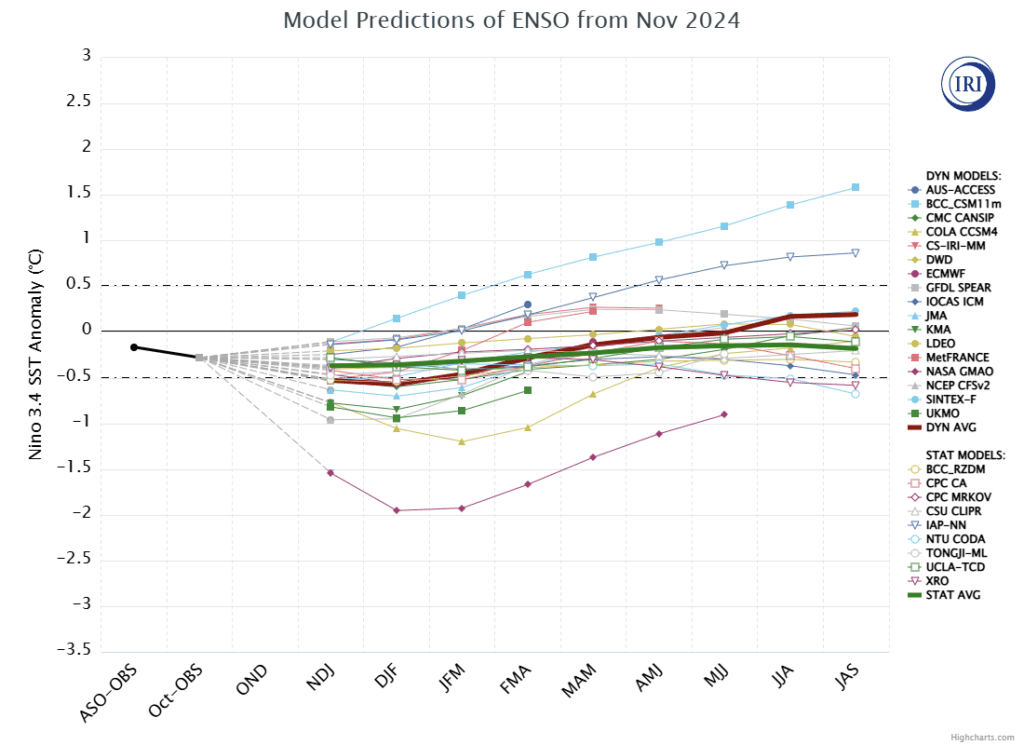
Source: The International Research Institute for Climate and Society, Columbia University Climate School
Seasonal Forecasts
The December – February seasonal precipitation forecast calls for likely (50-60% chance) below normal precipitation for an area that includes southern New Mexico and southwestern Arizona. The forecast leans (33-50% chance) toward below normal precipitation for an area that includes the remainder of Arizona.
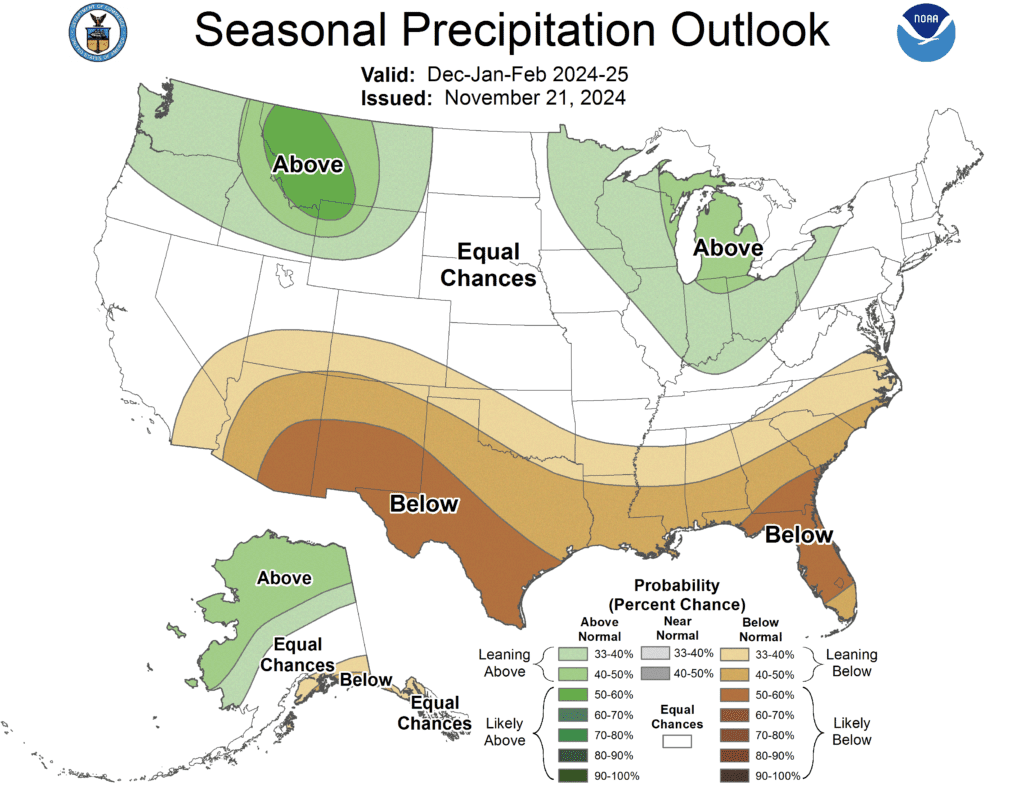
Source: Climate Prediction Center (NOAA)
The December – February seasonal temperature forecast calls for likely (50-70% chance) above normal temperatures for an area that includes most of New Mexico and most of Arizona. Western Arizona and northeastern New Mexico are included in the area where the forecast leans toward (33-50% chance) above normal temperatures.
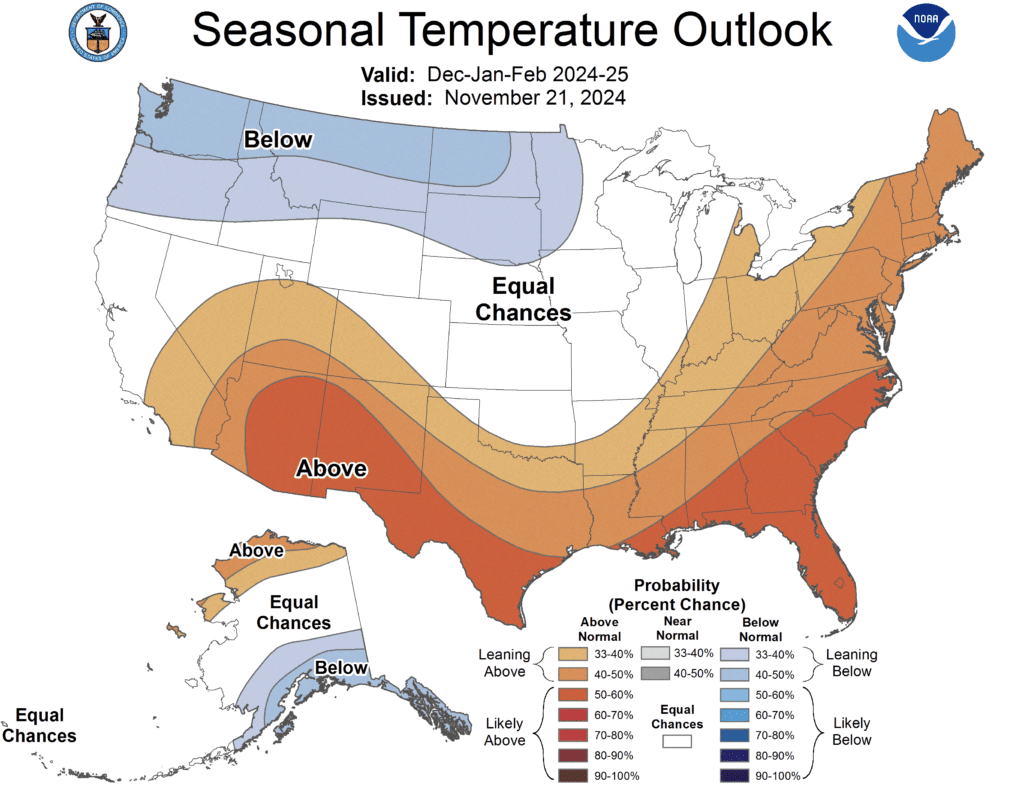
Source: Climate Prediction Center (NOAA)
Questions/Contact: Stacie Reece, [email protected]
Copyright 2024: EnviroInsight.org
