HAPPY 4TH OF JULY
EnviroInsight.org Four Items June 28, 2024
—————Feel Free To Pass This Along To Others——————
If your watershed is doing something you would like others to know about, or you know
of something others can benefit from, let me know and I will place it in this Information .
If you want to be removed from the distribution list, please let me know.
Please note that all meetings listed are open.
Enhance your viewing by downloading the pdf file to view photos, etc.
The attached is all about improving life in the watershed through knowledge.
If you want to be removed from the distribution list,
please let me know. Please note that all meetings listed are open.Check our website at EnviroInsight.org
Check our website at EnviroInsight.org
1. Happy Independence Day! The Fourth of July—also known as Independence Day or July 4th—has been a federal holiday in the United States since 1941, but the tradition of Independence Day celebrations goes back to the 18th century and the American Revolution.
On July 2nd, 1776, the Continental Congress voted in favor of independence, and two days later delegates from the 13 colonies adopted the Declaration of Independence, a historic document drafted by Thomas Jefferson.
From 1776 to the present day, July 4th has been celebrated as the birth of American independence, with festivities ranging from fireworks, parades and concerts to more casual family gatherings and barbecues. The Fourth of July 2023 is on Tuesday, July 4.
Even though many of the founding fathers signed the declaration of Independence on July 2nd, the Liberty Bell, located in Philadelphia, PA was rung on the 4th. The 4th was the day the bell was rung so hard, the crack formed in the bell while the document was being read aloud. More than ever before, the words have even greater meaning. “We hold these truths to be self-evident that all men are created equally“.
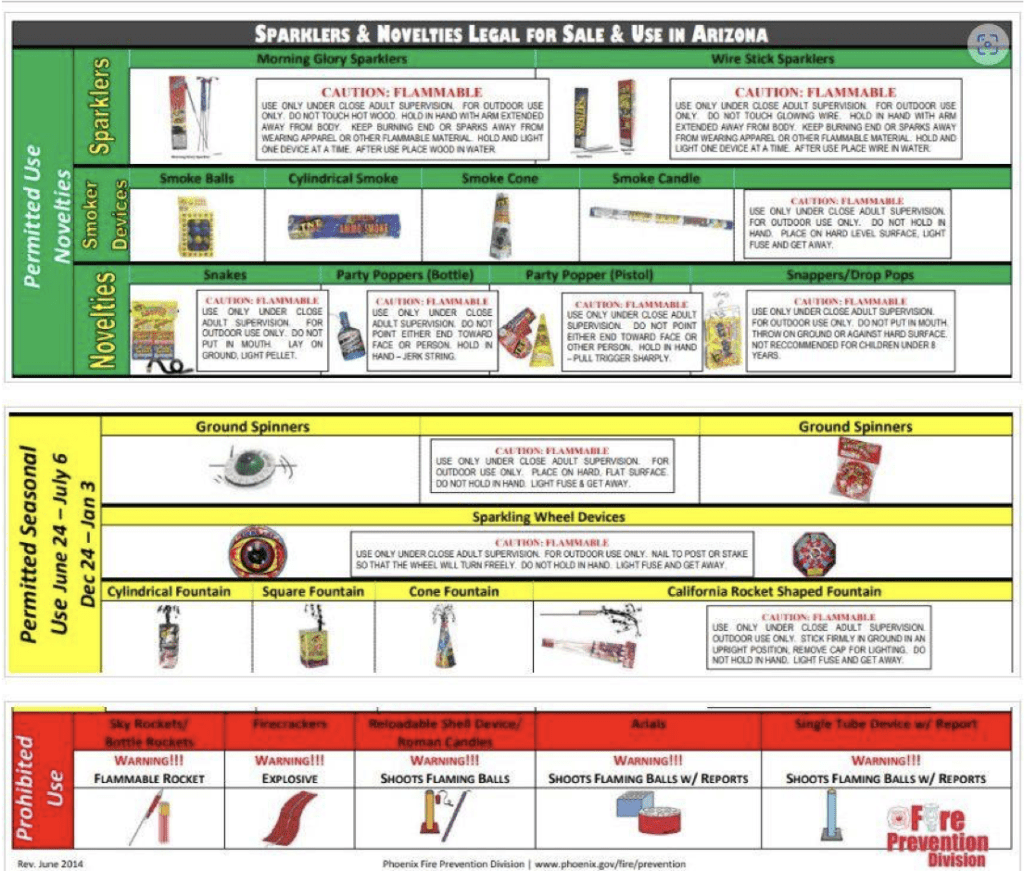
Celebrate your independence safely and legally. Remember, if it explodes in the air, it’s illegal!

2. Highlights from EPA’s 2024-2027 Climate Adaptation Plan Are Included Below.
Fostering a Climate-Ready Workforce
Building Facility Resilience
Developing Climate-Resilient Supply Chains
Integrating Climate Resilience into External Funding Opportunities
Integrating Climate Adaptation into Rulemaking Processes
https://www.epa.gov/climate-adaptation/climate-adaptation-plans
3. Let’s Talk About The San Pedro River

Arizona Regulatory Road Show: The Bed, The Bank And The Beyond
Wednesday, September 25, 2024
9 a.m. to 12 p.m.
Ethel Berger Center
2950 E Tacoma Street
Sierra Vista, AZ 85635

Please join representatives from Cochise County, US Army, Corps of Engineers, Arizona Department of Environmental Quality and others to talk about current regulations for activities in or near waters of the United States. For questions or to respond call Rosi Sherrill at 602-771-4409 or email [email protected]
4. Computer Modeling Shows Where Arizona’s Winter Precipitation Originates
The Sun Corridor in Arizona in the semi-arid Southwestern U.S. is a land of seeming unlimited growth that is constantly colliding with physical constraints. It is mountainous but also home to a large valley that includes one of the fastest growing metropolitan areas in the U.S.

While experiencing explosive growth, the Phoenix metropolitan area faces an uncertain future due to prolonged drought and fluctuating seasonal water availability. Planning for the future, especially in terms of water, has long been both a challenge and a staple of life in Arizona.
Now a team of researchers working with a weather model have uncovered new details of water availability in Arizona’s uplands and where that water comes from. The work may help in future planning of the Phoenix metropolitan area, as well as provide guides for coming precipitation seasons.
The Arizona uplands is home to the Salt-Verde watershed, which feeds the Arizona reservoir system and helps provide critical water resources needed to support the 5 million plus residents and businesses of Phoenix. The Salt-Verde watershed, located north-northeast of Phoenix, feeds a series of rivers in Arizona that provide about half of the municipal, industrial and agricultural water supply to the Phoenix metro area.
The rivers in this watershed are less sensitive to warming temperatures than many other important rivers in the western U.S. Therefore, warming temperatures are not an effective predictor of future Salt-Verde streamflow making the future of winter precipitation extremely important to understand.
The new work—carried out by a team of researchers from Arizona State University; Salt River Project (SRP), an Arizona utility; and Universidad de Santiago de Compostela, Spain—focuses on the precipitation in the Salt-Verde watershed during the winter months. It represents a new approach to improved precipitation predictability for Arizona and the Salt-Verde watershed.
Results of the work are reported in a paper titled “Modeling Salt-Verde Watershed Winter Precipitation Using Convection-Permitting WRF-Simulations with Water Vapor Tracers” in the Journal of Geophysical Research: Atmospheres.
The researchers applied a model (the Weather Research and Forecasting model, or WRF) with an important refinement that has been used in only a few locations elsewhere in the world to improve understanding of precipitation predictability. This new work pinpoints where wintertime precipitation for Arizona comes.
One surprising finding is that it is not the area normally associated with El Niño/La Niña, (equatorial tropical Pacific). The team found that the sea surface temperature across an area bounded by 140°W and 100°W, excluding the El Niño/La Niña areas, is the dominant source area of water for wintertime precipitation for Arizona.
Moreover, this work indicates that if sea surface temperature anomalies, or deviation from an average value of this newly pinpointed region is known, then that information can be used as a guide to wintertime precipitation forecasting for Arizona.
“We have identified the main moisture source region for wintertime precipitation across Arizona’s mountains,” said Matei (Matt) Georgescu, an associate professor in Arizona State University’s School of Geographical Sciences and Urban Planning and the director of the Urban Climate Research Center.
“This is a critical step in allowing us to improve seasonal precipitation forecasts for Arizona and potentially other regions across the globe as well.”
“The importance of evaporation from the Pacific Ocean near North America for Salt-Verde precipitation was surprising,” explained Bohumil (Bo) Svoma, a meteorologist at SRP and a co-author of the paper.
“In the western U.S., much attention is given to atmosphere river events that bring moisture to the West Coast from sub-tropical areas farther west in the Pacific where warm oceans during El Niño events provide a significant source of moisture. Since El Niño events tend to result in wet winters for Arizona, it was surprising that this central Pacific moisture source is not as important for Arizona precipitation.”
Previous work by Svoma and Georgescu, led by Joseph Karanja, a Ph.D. student at ASU, indicated that none of the standard El Niño/La Niña metrics provide a robust relationship determining spatial and temporal variability in historically observed wintertime precipitation for the Southwestern U.S.
In the new work, the researchers took historical data for three different types of El Niño/La Niña winters (warmer than average, average and cooler than average) and ran those through the WRF for the four-month periods of December through March to simulate precipitation and examine the model’s performance with the historical data on rainfall.
In each case it did match, with the warmer (El Niño) winter coinciding with more precipitation, the normal winter with somewhat less and the cooler winter (La Niña) experiencing even less precipitation.
The researchers then reran the WRF model where they masked individual geographical regions, which determines how much water sourced from that specific area eventually falls as precipitation over the Salt-Verde watershed.
In total, these simulations revealed the main source for the precipitation Arizona typically experiences during winter. That location, an area bounded by 140°W and 100°W and south of 40°N, excludes the El Niño/La Niña area commonly referred to as the El Niño 3.4 region.
“Our work sheds new light by highlighting that the standard El Niño/La Niña region may be less important, at least in terms of direct water vapor transport for Arizona seasonal/ winter precipitation than previously thought,” Georgescu said.
“Rather than focusing attention on sea surface temperature variability over the El Niño 3.4 region, we need to pay greater attention to sea surface temperatures closer to the U.S.-Baja coastline.”
“Even for the cold (i.e., La Niña) winter, where tropical sea surface temperatures are colder than average, more than half of the water that fell over Arizona originates from what we define as local sea evaporation, which we bound as between meridians 140°W and 100°W off the North American West Coast and south of 40°N,” said Francisco Salamanca-Palou, an ASU assistant research professor of Geographical Sciences and Urban Planning and lead author of the study.
The researchers say the tool can be useful to water managers in better understanding the source of water that falls in any location for a given storm or season. While it can be applied elsewhere, its use in Arizona is clear.
“Climate model projections of winter precipitation in Arizona are highly uncertain,” Svoma said. “Detailed research about the current climate is an important initial step for advancing our understanding of future precipitation in Arizona.”
“This research is critical for long term water supply planning in Arizona,” he added.
More information: Modeling Salt-Verde Watershed Winter Precipitation Using Convection-Permitting WRF-Simulations with Water Vapor Tracers, Journal of Geophysical Research: Atmospheres (2024).
Journal information: Journal of Geophysical Research – Atmospheres
Provided by Arizona State University
Copyright: 2024 EnviroInsight.org
