Daniel Salzler No. 1222 EnviroInsight.org Three Items October 6, 2023
—————Feel Free To Pass This Along To Others——————
If your watershed is doing something you would like others to know about, or you know
of something others can benefit from, let me know and I will place it in this Information .
If you want to be removed from the distribution list, please let me know.
Please note that all meetings listed are open.
Enhance your viewing by downloading the pdf file to view photos, etc.
The attached is all about improving life in the watershed.
If you want to be removed from the distribution list,
please let me know. Please note that all meetings listed are open.
Check our website at EnviroInsight.org
- You thought Arizona’s Summer Was Extreme? A ‘Strong’ El Niño Could Supercharge Winter. Following a record-hot summer, an unexpected west coast hurricane and an unpredictable Arizona monsoon, meteorologists are now watching conditions in the Pacific Ocean to see how El Niño might affect fall and winter across the West.
This year’s El Niño is expected to grow stronger and last longer, according to the latest outlook by the National Oceanic and Atmospheric Administration. There is a greater than 95% chance that the phenomenon will continue through early next year.
This El Niño is expected to continue strengthening until it reaches its peak sometime between January and March. That’s when the climate pattern can have the biggest effects on weather around the country, experts say.
Summer extremes:Maricopa County heat-associated deaths surpass 200 in 2023
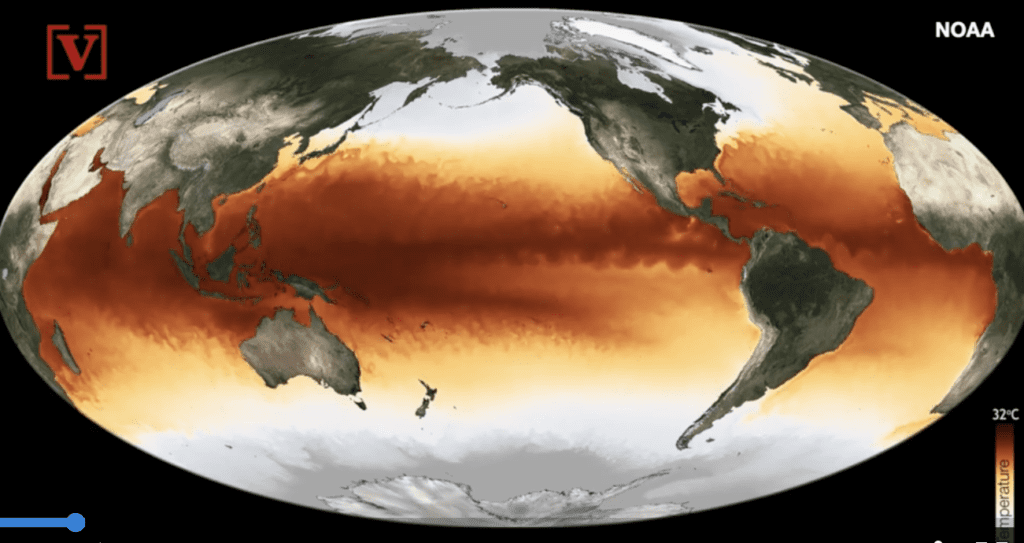
What is El Niño?El Niño is the name climate and weather scientists have given the warm phase of the El Niño-La Niña Southern Oscillation pattern. This phenomenon develops in a naturally occurring cycle when sea surface temperatures across the east-central equatorial Pacific Ocean climb above average. El Niño is typically associated with extreme weather and above-average precipitation in the western U.S.
ENSO is the most dramatic year-to-year variation of the Earth’s climate system, according to the National Oceanic Atmospheric Administration. The El Niño part of the cycle has the potential to rain down effects on a range of sectors including agriculture, public health, freshwater availability, power generation and economic activity in the United States and around the globe.
The warmer-than-average sea surface temperatures have already likely contributed to increased temperatures around the world, including a record-shattering heat wave in Arizona during July, which contributed to what ended as the hottest summer on record.
The global surface temperature for August was 2.25 degrees above average, making it the warmest August in NOAA’s 174-year global climate record. August was the fifth consecutive month that global sea surface temperatures hit a record high.
Sea surface temperatures across the Pacific can warm by 1–3 degrees Fahrenheit or more during an El Niño cycle, and these warmer conditions can last anywhere from a few months to two years. The unusual warmth is coupled with a slowdown of the easterly trade winds, as well as increased rainfall and a drop in surface air pressure in the central tropical Pacific.
What does an El Niño mean for the winter?
The effects of the El Niño cycle will stretch well beyond the summer months. According to NOAA’s most recent update, there is a 71% chance that this winter’s El Niño will be classified as “strong.”
The effects of an El Niño winter can vary across the country. The Pacific Northwest is expected to be drier and warmer during these events.
Typically, during El Niño winters, the powerful jet stream that develops over the equator will push more precipitation over the southern third of the U.S., including Arizona, New Mexico and California. NOAA says such conditions in the Southwest are most noticeable between October and March.
While the Southwest is known for its arid conditions, precipitation records over years to decades show dramatic swings from very wet to very dry years. Researchers at the University of Arizona say these yearly shifts, especially during the winter months, can be tied back to the El Niño.
Over the last few decades, scientists’ understanding of the impact of El Niño has improved. Most notably scientists can often detect the development of these patterns months before they arrive.
There is still plenty of variability when comparing El Niño events, and there is no guarantee that any given El Niño event will lead to wetter than average conditions, scientists say.
While knowing an El Niño will be present during the winter months, the scientists say there is no guarantee of a wet winter for the Southwest. A very strong El Niño in 2016 did not bring much relief in terms of winter precipitation.
Extreme drought:Lake Mead swelled with winter runoff, but states will still bank Colorado River water
Will an El Niño winter contribute to drought relief?
While El Niño’s exact effects on the Southwest remain uncertain, experts say a wetter winter would likely boost snowpack across the West. That could mean more runoff for the rivers that have struggled to keep up with demand in recent decades. Mountain runoff feeds major rivers, including the Colorado River and the Salt and Verde rivers in Arizona.
Experts say it would take more than one above-average winter to reverse a more than two-decade long drought.
Too much precipitation in a short time can also have negative effects, increasing the threat of flooding and landslides that can turn deadly and cause millions of dollars in damage.
The 1993 El Niño left an estimated $50 million in damage, according to the Arizona Geological Survey. U.S. Highway 95 east of Yuma was closed for nearly six months as the swollen Gila River carried heavy runoff from rain.
How has climate change affected ENSO patterns?
While these weather events have been occurring for centuries or longer, scientists believe climate change will likely influence the way the storms develop and the impacts they bring.
A report released earlier this year by the World Meteorological Organization found that worldwide, temperatures will likely surpass record levels within the next five years due to heat-trapping greenhouse gasses. Source: Arizona Republic Sept 16, 2023
2. A Massive, Two-Fault Earthquake May Have Struck the Pacific Northwest 1,100 Years Ago. What Tree Rings Can Tell Us. The region needs to be prepared for the possibility of more intense quakes than previously thought, a new study of tree rings finds.
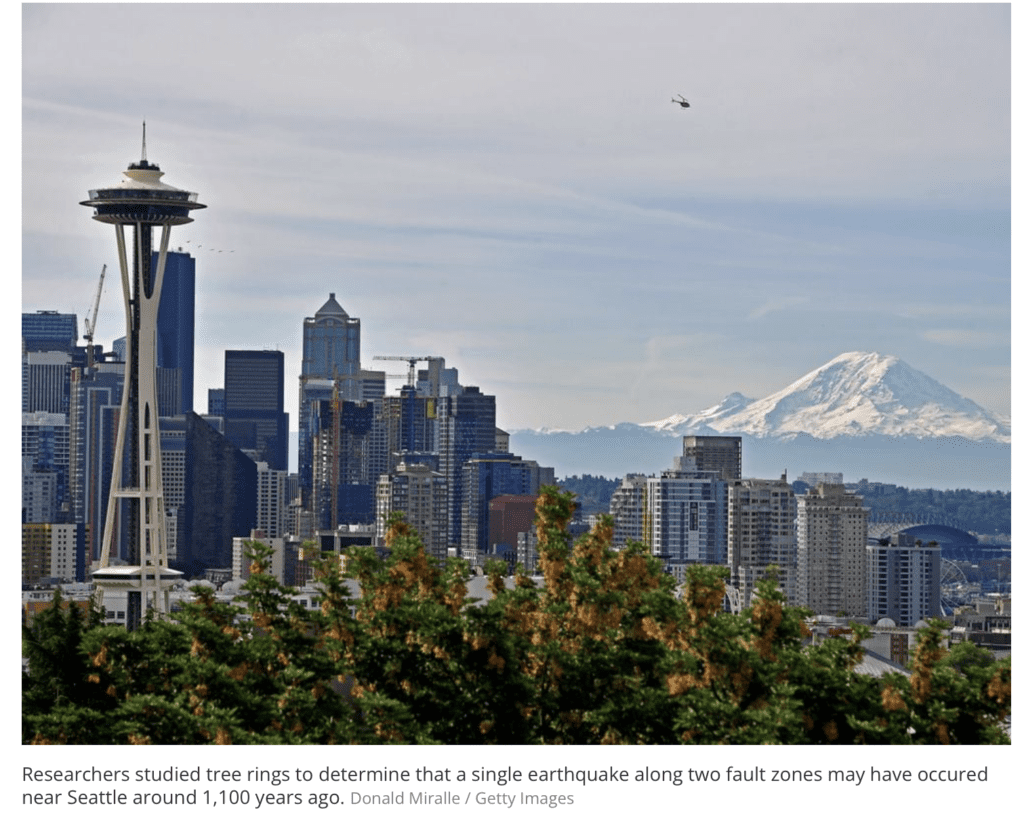
Using tree ring dating, scientists have revealed a massive earthquake—or two in succession—struck the Puget Sound region in the Pacific Northwest almost exactly 1,100 years ago.
The destructive event demonstrates that the area—which contains Seattle, Tacoma and Olympia, Washington—could be susceptible to more extreme earthquakes than previous research had indicated.
Scientists already knew that multiple quakes shook the region between 780 and 1070 C.E.(Common Era, same as A.D.), but they could not precisely date each one—for some, they could pinpoint only a wide window of more than 100 years. The new study, published last week in the journal Science Advances, gets much more specific: Researchers say two fault zones near Seattle ruptured within a six-month period between 923 and 924 C.E. Whether these faults ruptured at the same time, or spread a couple of months apart, the resulting quakes would each have been more than magnitude 7.3, per the paper.
“It’s showing that these complex, large earthquakes are a real possibility,” Bryan Black, lead author of the study and tree ring dating expert at the University of Arizona, tells Scientific American’s Robin George Andrews.
To find out if such a calamitous event happened 1,100 years ago, the researchers turned to trees. They knew that earthquakes at that time caused mass tree death by sparking landslides and a tsunami, burying and drowning trees throughout the region. Precisely determining when the trees died would reveal when the earthquakes took place.
The researchers analyzed Douglas Fir rings from six sites around Puget Sound. By comparing the trees’ rings to each other and to those in a reference chronology, they determined the trees died between October 923 and March 924.
To bolster their confidence in the finding, the team scoured the tree rings for a telltale sign that aids in dating: a spike in stellar radiation called a Miyake event. This event, which could have been a solar flare or an exploding star, would have left a signature jump in carbon-14 concentration within the trees, writes the Seattle Times. They located such an event between 774 and 775 C.E. and used that as a reference point in dating, confirming the last tree ring across the sampled sites was 923 C.E.
“I am in awe of the power this method shows to precisely date earthquakes for which we have no direct historic records,” Tobin tells Scientific American. “The result seems extraordinarily robust.”
Based on the results, the researchers estimate that during this six-month window, either two closely spaced earthquakes of magnitude 7.5 and 7.3 or a single, multi-fault earthquake around magnitude 7.8 struck the area. The single earthquake scenario, however, is around three times as likely as the two separate quakes, the authors write.
3. Arizona’s Biggest City Has Driest Monsoon Season Since Weather Service Began Record-Keeping In 1895.
After a summer of extreme heat, Arizona’s most populous city is in the record books again. This time Phoenix is notching a record for dry heat.
The National Weather Service said Sunday that the monsoon season this year in the arid Southwest dropped only 0.15 inches (.38 centimeters) of rainfall from June 15 to September 30. That’s the driest since the agency began keeping records in 1895. The previous mark was 0.35 inches in 1924.
The monsoon season normally runs for about three months each year starting in June, when rising temperatures heat the land and shifting winds carry moisture from the eastern Pacific and Gulf of California to the Southwest via summer thunderstorms.
Phoenix’s average rainfall during a monsoon season is 2.43 inches (6.1 centimeters). Arizona gets less than 13 inches (33 centimeters) of average annual rainfall as America’s second driest state behind Nevada, which meteorologist say averages less than 10 inches (25.4 centimeters) of rain per year compared to the national average of about 30 inches (76 centimeters).
Nevada has struggled with drought conditions since 2020. New Mexico, the fourth driest state in the U.S. with an average annual rainfall of about 14 inches (35.5 centimeters) per year, also has been affected by the drought in recent years.
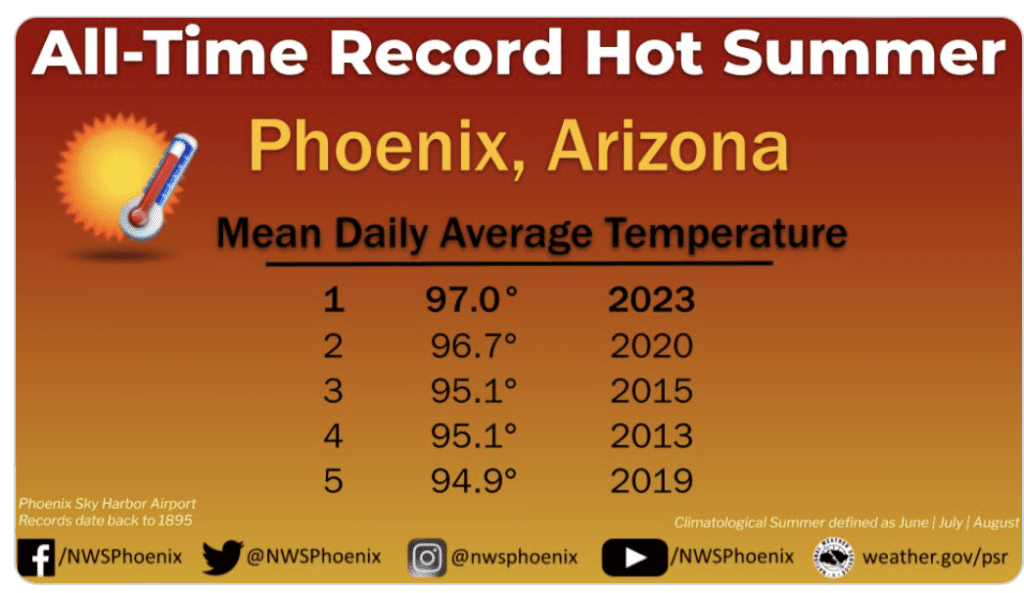
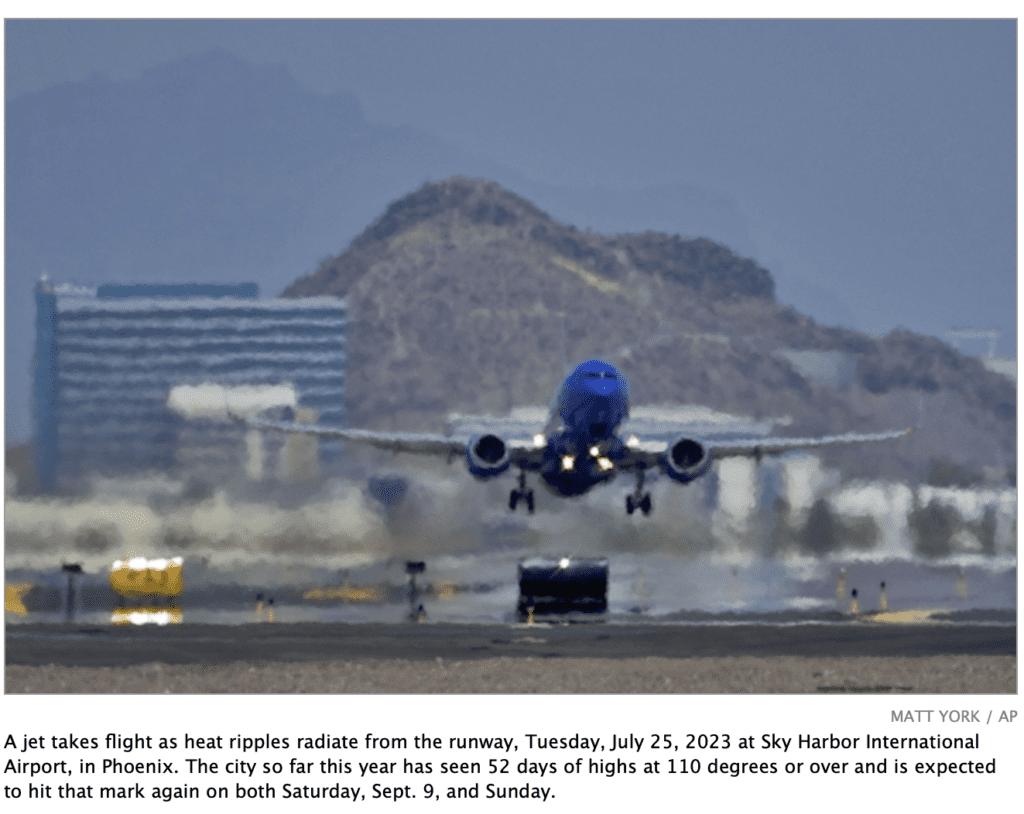
Phoenix this summer experienced the hottest July and the second-hottest August. The daily average temperature of 97 F (36.1 C) in June, July and August passed the previous record of 96.7 F (35.9 C) set three years ago.
In July, Phoenix also set a record with a 31-day streak of highs at or above 110 F (43.3 C), creating a health hazard for people whose bodies were unable to cool off sufficiently amid the persistent, relenting heat.
Confirmed heat-associated deaths in Arizona’s most populous county continue to rise in the aftermath of the record summer heat.
Maricopa County public health data shows that as of Sept. 23, there were 295 heat-associated deaths confirmed with a similar number — 298 — still under investigation for causes associated with the heat.
The rising numbers are keeping Maricopa on track to set an annual record for heat-associated deaths after a blistering summer, particularly in Phoenix. No other major metropolitan area in the United States has reported such high heat death figures or spends so much time tracking and studying them.
Scientists predict the numbers will only continue to climb as climate change makes heat waves more frequent, intense and enduring.
Copyright: 20923 EnviroInsight.org